By L8MS Team · Updated 10 Nov 2026
Trend readings in the site menu opens Compare readings. Pick a reading and see how every asset on the site has done — useful for spotting drift before it fails, or showing a trend to a client.
Steps
Choose the reading to compare (any number test, for example a hot outlet temperature) and the date range.
The table lists every asset with that reading: number of Readings, Latest, Min, Max, Average and how many were Outside limits. Search by asset or location, or tick Outside limits only.
-
Tick up to 7 assets to draw them on the Chart. The chart also shows the test’s Limits, the site’s Median and its typical range (the middle 80% of assets).
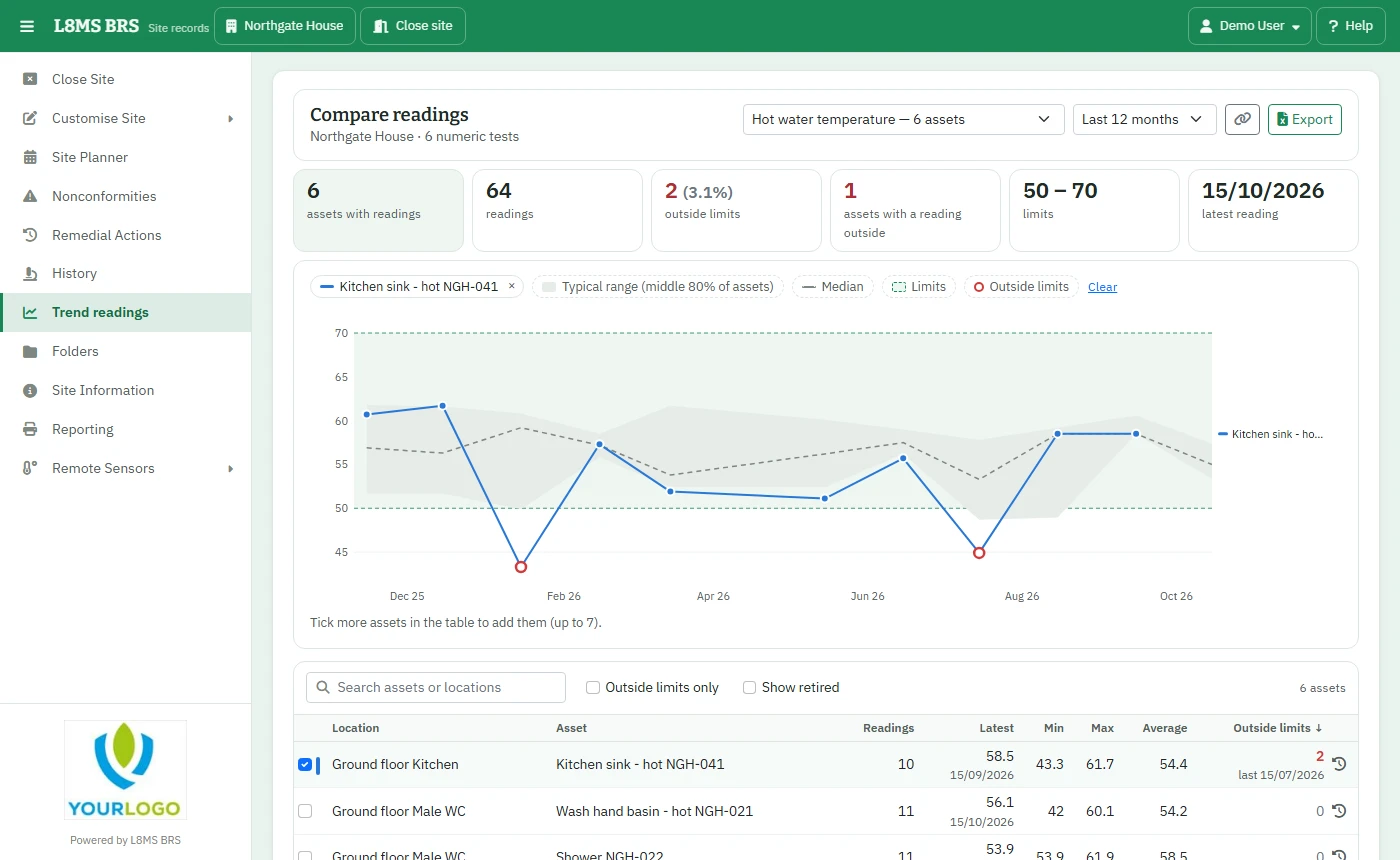 Comparing readings.
History on a row opens that asset’s asset history.
Export downloads the summary and every reading in the range to Excel, with the chart.