By L8MS Team · Updated 10 Nov 2026
AE Reports › KPI Report › Completion shows how much scheduled monitoring is actually being done.
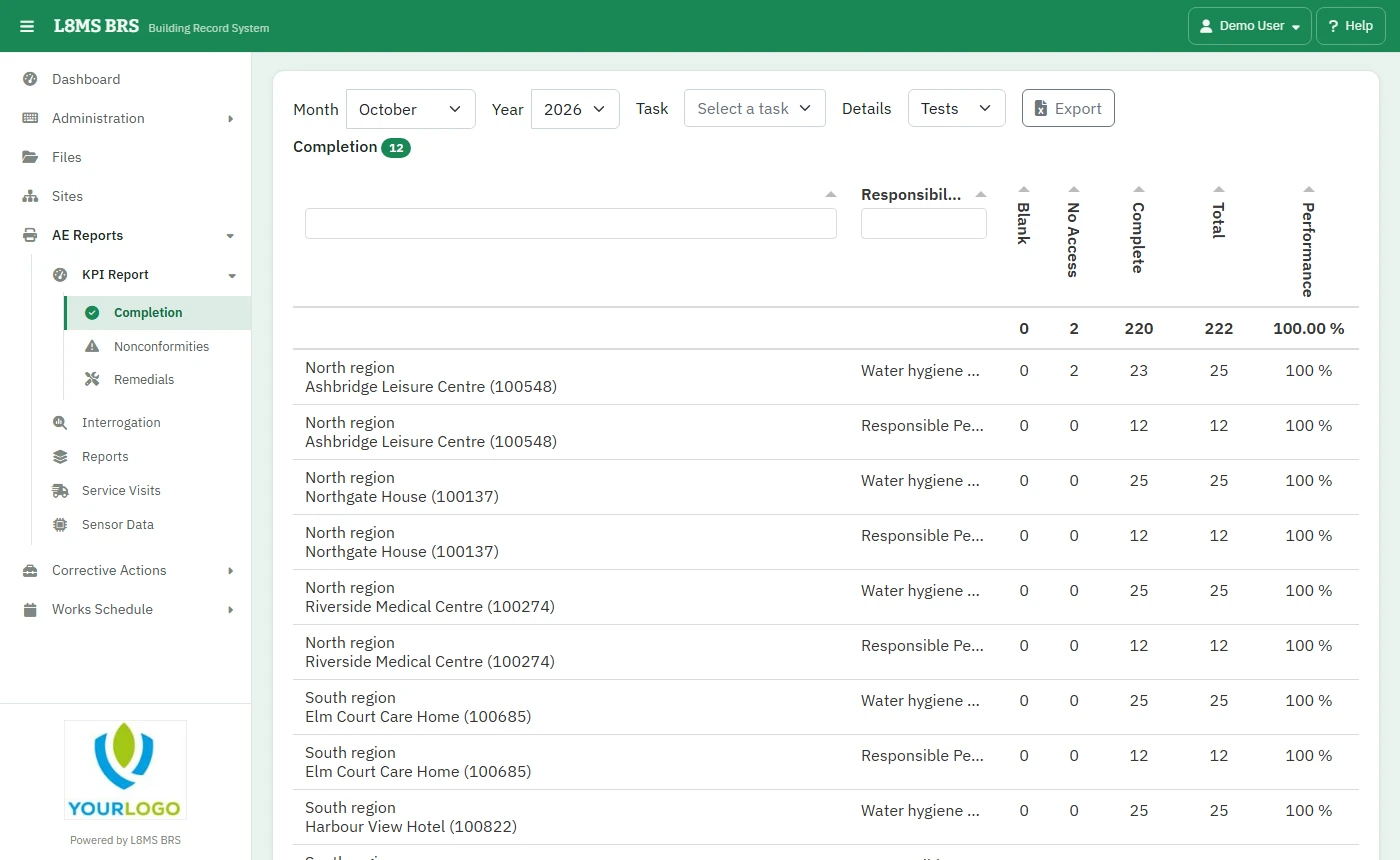 KPI: completion.
Steps
Choose the Month, Year and Task (or All), and scope by group, site and responsibility.
-
Read the figures:
- Total — tests scheduled.
- Complete — tests with a result.
- No Access — tests marked no access.
- Blank — scheduled but nothing recorded.
Performance Trend (Last 6 Months) charts the completion rate.
Open Details to see the tests and assets behind the figures. Outstanding work can be assigned to an existing service visit, or a new one added.
Export downloads the table to Excel.
Completion %Completion is Complete as a share of Total. No access and blank both count against it.